Larry Hughes: Dataflow Diagrams
Dataflow Diagrams
Basic Dataflow Notation


- Processes
-
Circles ("bubbles")
labeled with actions
represent functions
that transform inputs into outputs.
- Data Flows
-
Directed arrows
labeled with data type
represent data moving through the system
- Data Stores
-
Bars (also boxes and ellipses)
labeled with data type
represent data or aggregates of data
that must be remembered for a period of time
(typically implemented as files or database)
- Externals/Terminators
-
Boxes
represent external entities (source/sink)
with which the system communicates
(e.g., individuals, groups, external computer systems)
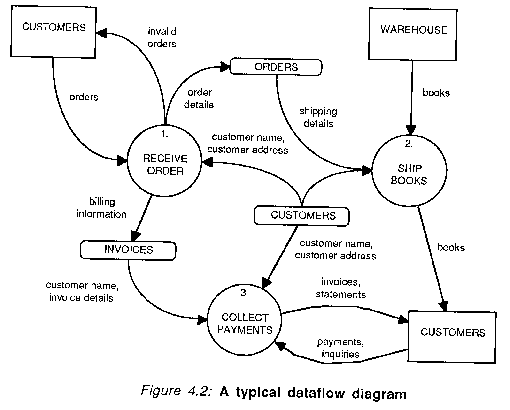
A Typical Dataflow Diagram
Levels in a Set of Diagrams
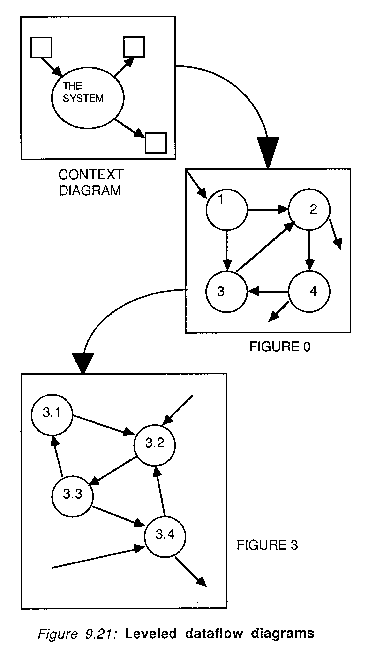
- The Context Diagram
-
- shows the relation (data flows in and out)
of the "system" to external entities (i.e., terminators)
- Diagram/Figure 0
-
- first level decomposition of system
into major processes (e.g., input, transform, output)
- contains 2-10 processes
but do not suddenly show a huge amount of detail
or show a trivial decomposition
- hides external entities but maintains in/out flows
- data stores are shown here (and at lower levels)
- Subdiagrams / Process Descriptions
-
- provide more detail about a process
- process descriptions use 10-40 lines of structured text
- both "balance" in/out flows with higher level
- names are usually related to parent (e.g., parent.child)
- Data Dictionary
-
- definitions of flows, stores
- data on in/out flows of processes
Leveled Dataflow Diagram
Rules for Drawing Dataflow Diagrams
Drawing Diagrams
- each process should have both input and output
What does it mean if one is missing?
- each store probably has both input and output
What does it mean if one is missing?
Why have a write-only store?
Might have a read-only store.
- data cannot flow between stores
not even if you put the stores close to each other
- diagrams must be balanced across levels
flows in/out of context diagram == flows in/out of diagram 0
all parent/child digrams must be balanced
Naming in Diagrams
- ALL elements should be named
use meaningful/specific names
(not "Transform Data")
- data flows are named after the flowing data
record, form, order, ...
unlabeled flows represent complete records
- data stores are named after the stored data
records, forms, orders, ...
- processes state transformations as imperatives
Read Input, Calculate Interest, Save Results, ...
(not Reader, Calculator, File Cabinet)
- processes should be numbered hierarchically
1.2.4 is a subprocess of 1.2
- external entities named after what they represent
person, organization, other system
Strategies for Drawing Dataflow Diagrams
The process may be unstructured, tedious, and iterative,
but the result must be well-organized.
- determine the system boundary
try to consider a larger context at first
because extending systems is harder than reducing their scope
- identify system inputs/output
input/display devices create inputs/outputs,
but focus on what information is flowing, not how
emphasize data flow, not material flow
- draw initial context diagram
mentally trace data paths
does each input contribute to an output?
- identify stores
files (electronic or manual), documents, collections, references
- draw top-level diagram (0) of whole system
focus your efforts here,
perhaps showing more detail than other diagram
trace some complex processes
forward from inputs
backward from outputs
- develop an initial data dictionary
system inputs/outputs, data stores, internal data flows
emphasize logical rather than physical description
(do not model trivial changes of format/media)
- evaluate the diagram and refine/repartition the diagram
use walkthroughs to find mistakes
combine many small processes / break complex processes,
but make the changes based on content, not just size
- continue decomposition until primities are reached
stop when a transformation is trivial
(e.g., a single function)
Evaluation and Refinement of a System Description
Evaluation Criteria
- Completeness
-
- Are all requirements met?
What if too few/many are met?
- Is the system boundary correct?
looking at the context digram and diagram 0
- Consistency
-
- Do all components fit together?
- Do all levels balance?
- Correctness
-
- Is the system description syntactically correct?
- Is the system description semantically correct?
- Communication
-
- Can people (users, developers, ...) understand the description?
(users may only look at Diagram 0)
- Are good names used?
- Is the hierarchy of reasonable breadth/depth?
no diagrams with 1-2 or 10+ processes
no process specifications of 1-5 or 100+ lines
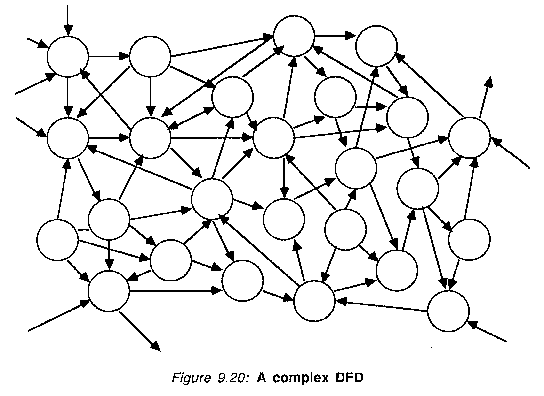
- Are the diagrams neat?
not a tangled mess
(use multiple instances of stores to avoid a web)
- Are the materials well-organized?
table of contents, paginated reports, section headings
A Complex Dataflow Diagram
Refinement of Dataflow Diagrams
- Independence of Transformations
-
- Maximize modularity, minimize coupling
design general processes
- Use topological repartitioning
"promote" subdiagrams and then refactor it
- Reduce shared information (among processes)
use a database to store data for later use
- Use direct data flows
not through several processes
- Aggregation of Related Transformations
-
- Maximize cohesion within subdiagrams
processes in a subdiagram should share attributes
From Perlman, Ohio State University, 1996


