Introduction
On 1 April 2023, the federal price on carbon will increase
from $50/tonne of CO2e to $65/tonne.
All provinces, including Nova Scotia, will be expected to price their emissions
accordingly.
There has been a Canada-wide benchmark price on carbon since
2019, when it was $20/tonne. To most Canadians, the price and associated cost
were listed on purchases of any carbon-intensive energy source, such as
gasoline. One notable exception was Nova Scotia's carbon pricing system which
not only hid the price from consumers but ensured that Nova Scotians paid the least per tonne of carbon emitted.
All provinces were expected to submit their new carbon
pricing systems proposals (for 2023 onwards) to the federal government in
August 2022. Nova Scotia's plan, which was to be a continuation of the province's original program,
was rejected by the federal government, despite a last-minute plea from Timothy Halman, Nova
Scotia's Minister of Environment and Climate Change.
Consequently, Nova Scotia will join four other provinces that do not have their
own benchmark, Ontario, Manitoba, Saskatchewan, and Alberta, and are subject to
the federal stringency requirements (or carbon pricing system). In the federal
system, consumers pay the carbon price on any emissions-intensive fuel they
purchase. About 90% of the monies collected are returned by the federal
government as a quarterly Climate
Action Incentive Payments (or CAIP) to low-and middle-income individuals
and households considered least able afford their carbon price. High-income
individuals and households do not receive the CAIP and are expected to change their behaviour rather
than continuing to pay the carbon price.
This report examines the potential impact of the federal
carbon price on 36 different combinations of household size, household heating
requirements, household electricity use, and vehicular use in Nova Scotia. To
estimate the value of the CAIP required for Nova Scotians, the federal price on
carbon for 2022-23 ($50/tonne of CO2e) is determined for the
emissions associated with the 36 household combinations. Then, the CAIP made
to the same size of household in Ontario (the province with the lowest CAIP)
and Saskatchewan (the province with the highest CAIP) is compared with the Nova
Scotia carbon costs. The results show that if Ontario's CAIP was used in Nova
Scotia, all the households examined would suffer a loss; however, if Nova
Scotian households received Saskatchewan's CAIP, small, low-energy consumption
households would receive a rebate exceeding what they had paid. The CAIP for
high-energy consumption households would not cover the household's carbon cost.
The report also identified several shortcomings with the
federal system that will need to be addressed, preferably in the near-term.
The report argues that rather than fighting the federal government, the Nova
Scotia government should take the recommendations made in this report and
develop a better, more equitable carbon pricing system.
Emissions sources
Nova Scotians will be subject to carbon pricing for their
residential emissions in three energy services (space heating, domestic hot
water heating, and lighting and appliances) and the transportation sector.
Carbon prices vary by energy source. The more CO2e
produced per unit of energy consumed, the higher the carbon price for the
energy source. The carbon prices for the energy sources used in this report
are listed in Table 1.
Table
1: Carbon content and carbon-price for 2022-2023 at $50 per tonne
|
Energy source
|
CO2e content
|
Volume per tonne
|
Carbon price at $50/tonne
|
|
Light fuel oil
|
2.755 kg/L
|
362.9 L/t
|
13.78 ¢/L
|
|
Electricity
|
0.598 kg/kWh
|
1,675.0 kWh/t
|
2.99 ¢/kWh
|
|
Gasoline
|
2.307 kg/L
|
433.5 L/t
|
11.54 ¢/L
|
|
Natural gas
|
51.5 kg/GJ
|
19.4 GJ/t
|
257.50 ¢/GJ
|
We examine a range of possible emissions and carbon prices
for these energy sources assuming that Nova Scotia had been subject to the 2022-2023
federal price on carbon.
Space heating
Most Nova Scotian homes are heated by a combination of one
or more energy sources: heating oil, electricity, and wood. Figure
1 shows the number and types of heating systems used in the province in 2019,
when slightly over half of the homes used heating oil for heating, about 22
percent used electricity (excluding heat pumps), and almost 14 percent used
wood in combination with another fuel source, such as fuel oil or electricity.
A small but growing number of households use heat pumps (4.9 percent) and wood
(3.7 percent), with limited numbers heating with natural gas, propane, and
coal.

Figure
1: Total residential heating system stock by fuel
source in Nova Scotia in 2019
All these energy systems emit greenhouse gases. The
quantity is normally expressed as its emissions intensity, or the greenhouse
emissions per unit of energy consumed, such as a litre of fuel or kilowatt-hour
of electricity. Table 2 shows the emissions intensities of the energy sources
to which the federal carbon-levy is applied. For example, for every litre of
fuel oil used, 2.755 kg of CO2e are emitted. Using about 363 litres
of fuel oil produces a tonne of CO2e.
Table
2: Emissions intensity of household energy sources
|
Source
|
Emissions
intensity
|
Volume
to produce one tonne of CO2e
|
kg CO2e/GJ
|
|
Fuel oil (NIR)
|
2.755 kg/L
|
363.0 L
|
79.5
|
|
Natural gas (NIR)
|
51.5 kg/GJ
|
19.4 GJ
|
51.5
|
|
Electricity 2020 (NIR)
|
670 g/kWh
|
1.49 MWh
|
186
|
|
Electricity 2020 (NSP)
|
626 g/kWh
|
1.60 MWh
|
174
|
|
Electricity 2021 (NSP)
|
598 g/kWh
|
1.67 MWh
|
166
|
The table also compares the emissions for every gigajoule
(GJ) of energy consumed. Natural gas produces about 51.5 kg of CO2e,
fuel oil about 79.5 kg, and in 2021, Nova Scotia Power emitted 166 kg per GJ.
Three separate values are shown for electricity: one from
the National Inventory Report showing Nova Scotia Power's emissions for 2020,
and two from NSP for 2020 and 2021 (their most recent value). The difference
between the NIR's value for 2020 (670 g/kWh) and Nova Scotia Power's (626
g/kWh) can be attributed to what is considered "electricity generation". The
NIR only considers the volume of electricity generated in Nova Scotia, whereas
Nova Scotia Power includes out-of-province purchases thereby increasing the
volume of electricity considered.
To get an understanding of the cost of the carbon levy to a
typical 1,700 square-foot household, household space-heating consumption data
from Efficiency Nova Scotia is used:
● Three
space heating requirements are examined: 30 MBTU (a new house meeting the
R-2000 standard), 50 MBTU (a new house), and 80 MBTU (an existing, "old"
house).[2]
● Three
energy sources (Fuel oil, Electricity, and Natural gas) and their typical
heating systems and efficiencies. For example, efficiencies range from 70%
(for a natural gas fireplace), to 95% for a condensing oil-furnace, to 300% for
an electric geothermal heat-pump.
The space-heating energy demand, emissions, and the carbon
levy for the various houses and heating systems are shown in Table
3. Each energy source requires a certain volume of energy to meet the
space-heating requirements of the different households. The volume of energy
varies depending on the conversion efficiency of the heating system and the
energy intensity of the energy source; for example, a 30 MBTU using an
air-to-air heat pump consumes 4,628 kWh, this increases to 12,340 kWh for a
house requiring 80 MBTU.
The emissions associated with each heating system and house
depend on the emissions intensity of the energy source (as shown in Table 1).
In a new house requiring 50 MBTU, the lowest emissions for each energy source
range from 3,965 kg for an oil furnace with a condensing boiler, to 2,916 kg
for an electric geothermal heat-pump, and 2,625 kg for a high-efficiency
natural gas furnace.
In 2022-2023, the federal levy will be $50 per tonne of CO2e.
Not surprisingly, the lower a household's emissions, the lower the cost of the
levy. This is apparent in houses using electricity for heating, the levy on an
80 MBTU can range from $233 for a house with a geothermal heat-pump to $823 for
a house with radiant in-floor heating using an electric furnace.
The minimum and maximum carbon levy costs for the three house
types are shown in Table 4. The lowest cost is $79 for a new R2000 home heating
with a 93% efficient furnace burning natural gas, while the highest possible
cost is $823 for a house requiring 80 MBTU using radiant in-floor heating.
Table 4: Minimum and
Maximum carbon levy cost (from Table
3)
|
Carbon levy cost
|
New R2000 30 MBTUs
|
NEW - 50 MBTUs
|
OLD - 80 MBTUs
|
|
Minimum
|
$79
|
$131
|
$210
|
|
Maximum
|
$309
|
$515
|
$823
|
Domestic hot water
Figure 2 shows Nova Scotia's domestic hot water (DHW)
heating stock in 2019, when over 97 percent of Nova Scotian households used
either electricity (224,741 households or 49.5%) or heating oil (217,129
households or 47.8%). Both have been increasing steadily since 2000, although
the number of households heating with oil increased by 36% compared to those
using electricity, which increased by only 10.4%.

Figure
2: Domestic Hot Water stock for Nova Scotia in 2019
(Other includes coal, propane, and natural gas)
Despite the roughly even split between the number of
households using electricity and heating oil, about 55.4% of the energy used
for producing domestic hot water (DHW) came from heating oil and 37.7% from
electricity, with the remainder produced by wood (6.8%) and less than one
percent from other sources including natural gas. This gives an indication of
the efficiency of the water heating systems.
As with space heating, a variety of factors affect the
carbon cost of supplying a household with DHW: the number of people in the
household, the water heating system used, and the efficiency of the system, as
shown in Table 5. For example, in a two-person household, carbon costs range
from $43 for a high-efficiency oil boiler to $80 for an old electric water
heater, while in the six-person household, the costs range from $129
(high-efficiency oil boiler) to $240 (old electric water heater).
Natural gas was not included in the DHW analysis because of
its limited penetration.
Table
5: DHW Carbon-levy costs
Seasonal (winter/summer) efficiencies assumes seven months for winter [Oct-Apr]
and
five months for summer [May-Sep] (System types and efficiency data from Efficiency Nova Scotia)
|
System
type
|
Efficiency
|
Energy
|
Emissions
|
Levy
|
|
Two
person
|
Four
person
|
Six
person
|
Two
person
|
Four
person
|
Six
person
|
Two
person
|
Four
person
|
Six
person
|
|
Electricity
|
|
kWh/year
|
t CO2e/year
|
Levy
|
|
Electric water heater - old
|
85%
|
2,675
|
5,350
|
8,026
|
1.60
|
3.19
|
4.79
|
$80
|
$160
|
$240
|
|
Electric water heater - new
|
90%
|
2,527
|
5,053
|
7,580
|
1.51
|
3.02
|
4.53
|
$75
|
$151
|
$226
|
|
Instantaneous heater
|
95%
|
2,394
|
4,787
|
7,181
|
1.43
|
2.86
|
4.29
|
$71
|
$143
|
$214
|
|
Oil
|
|
Litres/year
|
t CO2e/year
|
Levy
|
|
Stand alone water heater
|
55%
|
385
|
770
|
1,154
|
1.06
|
2.12
|
3.18
|
$53
|
$106
|
$159
|
|
Tankless coil - Winter
|
75%
|
282
|
564
|
847
|
0.78
|
1.56
|
2.33
|
$71
|
$143
|
$214
|
|
Tankless coil - Summer
|
25%
|
847
|
1,693
|
2,540
|
2.33
|
4.67
|
7.00
|
|
High efficiency boiler - Winter
|
75%
|
282
|
564
|
847
|
0.78
|
1.56
|
2.33
|
$43
|
$86
|
$129
|
|
High efficiency boiler - Summer
|
60%
|
353
|
705
|
1,058
|
0.97
|
1.94
|
2.92
|
|
Natural gas
|
|
GJ/year
|
t CO2e/year
|
Levy
|
|
Stand alone heater - conventional
|
55%
|
15
|
30
|
45
|
0.77
|
1.53
|
2.30
|
$38
|
$77
|
$115
|
|
Instantaneous heater
|
93%
|
9
|
18
|
26
|
0.45
|
0.91
|
1.36
|
$23
|
$45
|
$68
|
|
High efficiency boiler - Winter
|
90%
|
9
|
18
|
27
|
0.47
|
0.94
|
1.41
|
$24
|
$48
|
$72
|
|
High efficiency boiler - Summer
|
85%
|
10
|
19
|
29
|
0.50
|
0.99
|
1.49
|
Lighting and Appliances
The third source of residential emissions is from lighting
and appliances. These are indirect emissions in that most lighting sources and
appliances used in Nova Scotia rely on electricity from Nova Scotia Power.
The average electricity consumption for lighting and appliances per person per household is
estimated to be 2.3 MWh. The electricity consumption and carbon costs for a
two-, four-, or six-person household are listed in Table 6. The costs range
from $138 to $277, to $415, for the two-, four-, and six-person households,
respectively.
Table 6: Lighting and
appliances electricity consumption in Nova Scotia for 2019
|
|
Two
person
|
Four
person
|
Six
person
|
|
Consumption (MWh/yr)
|
4.64
|
9.28
|
13.91
|
|
Emissions (tonnes)
|
2.77
|
5.54
|
8.31
|
|
Levy
|
$138
|
$277
|
$415
|
Transport
In 2019, there was a total of 326,530 cars and 258,891 light
trucks on Nova Scotia's roads. Between 2000 and 2019, the total number of cars
and light trucks increased by 34.6%. Most of the growth occurred in light
trucks, which increased by 89.2%, while cars rose by only 9.6%. As Figure 3 shows, the number of cars has been decreasing since the peak in 2011; all
the growth has been due to light vehicles.

Figure
3: Nova Scotia volumes of cars and light trucks between
2000 and 2019
In Table 7, the average distance driven, fuel consumption,
and estimated carbon cost are listed for cars and light trucks. Based on the
average values, the expected carbon emissions for cars and light trucks will be
3.1 tonnes and 5.2 tonnes in 2023. The carbon costs will be $200 and $339 for
a car and light truck, respectively.
Table 7: Vehicle data
for 2019 and carbon prices
|
|
Cars
|
Light
trucks
|
Total
|
Weighted
average
|
|
Stock
|
326,530
|
258,891
|
585,421
|
|
|
Average annual distance (km)
|
21,068
|
22,205
|
|
21,571
|
|
Fuel consumption (L/100km)
|
6.3
|
10.1
|
8.0
|
|
Estimated annual consumption (L)
|
1,327
|
2,248
|
1,724
|
|
Fuel emissions (kg/L)
|
2.32
|
2.32
|
2.32
|
|
Total emissions (t)
|
3.1
|
5.2
|
4.0
|
|
2023 Cost per vehicle ($65/tonne)
|
$153
|
$259
|
$199
|
Since the type of vehicle driven by a household is not
known, the vehicle used in the carbon cost estimates is based on a weighted
average of the distance driven and fuel consumption of the cars and light
trucks there are in the province. The hypothetical vehicle would emit 4 tonnes
and have a carbon cost of $200 in 2022-2023.
There were 0.60 vehicles per person in Nova Scotia in 2019.
The number of vehicles per household is assumed to be 1.2, 2.4, and 3.6, for
the two-, four-, and six-person households, respectively.
Application of 2022-2023 carbon price
The cost of a household's carbon emissions is the sum of the
carbon costs for the household's space heating emissions, domestic hot water emissions,
lighting and appliance emissions, and transport emissions.
Using the data described in the previous sections, carbon
costs are estimated for 36 different household combinations where:
● A
household consists of two, four, or six people.
● Heating
demand is either 30, 50, or 80 MBTU, and is met by one of fuel oil,
electricity, or natural gas.
● Domestic
hot water demand is met by oil or electricity and determined by the number of
people in the household.
● Electricity
demand for lighting and appliances is based on the number of people in the
household.
● Private
transportation for households assumes one vehicle for every two people.
The carbon price is applied to the minimum and maximum
emissions from space heating and domestic water heating, lighting and
appliances, and transportation for three different household sizes (two, four,
and six people). The combinations are summarized in Table 8, where:
● Minimum
space heating carbon costs refer to the high-efficiency natural gas boilers.
● Maximum
space heating carbon costs refer to radiant in-floor heating.
● Minimum
water heating carbon costs refer to the high-efficiency oil boilers.
● Maximum
water heating carbon costs refer to old electric water heaters.
Table 8: Interpretation
of carbon cost combinations
|
Combination
|
Space Heating for
30, 50, 80 MBTU Systems
|
Domestic Hot Water
for 2, 4, or 6 people
|
Lighting and
Appliances for 2, 4, or 6 people
|
Transportation for
2, 4, or 6 people
|
|
Min-Min
|
Minimum space heating cost for each system type.
|
Minimum DHW heating cost for number of people
|
Number of people in household
|
Number of people in household
|
|
Min-Max
|
Minimum space heating cost for each system type
|
Maximum DHW heating cost for number of people
|
|
Max-Min
|
Maximum space heating cost for each system type
|
Minimum DHW heating cost for number of people
|
|
Max-Max
|
Maximum space heating cost for each system type
|
Maximum DHW heating cost for number of people
|
The ranges of carbon costs for different family sizes and
heating systems are now examined. The results are an estimate, intended to
show the range of possible carbon costs for different sized households based on
their energy requirements.
Two-person family household
The emissions for a two-person household assume the use of
one vehicle and the lighting and appliance energy requirements for two people.
The DHW emissions for two people depend on the type of water heating system
used, while the space heating emissions depend on the heating system and assume
one of the three household heating demands.
As shown in Figure 4, the carbon costs to the household in
2022-2023 range from $499 (minimum space and water heating emissions) in the 30
MBTU house to $1,126 (maximum space and water heating emissions) in the 80 MBTU
house.
In the lowest carbon cost household (Min-Min), the dominant
cost is transportation ($238), whereas in the highest carbon-cost household
(Max-Max), the dominant cost is space heating ($669). In all cases, transportation
is the principal cost when the space heating costs are at a minimum.

Figure
4: Carbon costs for a two-person family household
Four-person family household
Increasing the size of the household increases the emissions
from water heating, lighting and appliances, and transportation. Space heating
emissions remain unchanged because the building's energy demand, and hence
emissions, remain constant, regardless of the number of people in the
household.
In a four-person household, carbon costs range from $918 in
the 30 MBTU Min-Min household to $971 in the 50 MBTU Min-Min household and
$1,010 in the 80 MBTU Min-Min household (see Figure 5). The highest overall
carbon cost of $1,582 is in the Max-Max 80 MBTU case.
In the household with a 30 MBTU space heating demand,
transportation costs of $477 for two vehicles exceeds the maximum space heating
emissions cost of $309. In the 50 MBTU household with the maximum heating
system, the heating system carbon cost of $515 exceeds the two-vehicle transportation
cost.
Transportation carbon costs also exceed the minimum space
heating carbon costs in an 80 MBTU household of $171. Transportation carbon
costs are exceeded in the maximum carbon cost case where the space heating cost
is $669.

Figure 5: Carbon costs for a
four-person family household
Six-person family household
In Figure 6, household carbon costs for the six-person
household are shown; they range from $1,338 (Min-Min household) to $2,039
(Max-Max household).
The principal cause of the increasing carbon cost in the
six-person household is the result of an increase in the consumption of
electricity for lighting and appliances and gasoline for transportation for the
increase in the number of vehicles.
In the 30 MBTU household, the carbon costs for lighting and
appliances ($415) and transportation ($715), exceeds the minimum and maximum
carbon costs for both space heating ($79 to $309) and DHW ($129 to $240). In
fact, the carbon cost of transportation in the six-person household exceeds the
carbon cost of space heating in all cases, including when the house is subject
to the maximum carbon cost for 80 MBTU of heat ($669).

Figure
6: Carbon costs for a six-person family household
Application of the Climate Action Incentive in Nova Scotia
Presently, four provinces are subject to the federal carbon
pricing program: Ontario, Manitoba, Saskatchewan, and Alberta. Qualifying
residents in these provinces receive a Climate Action Incentive (CAI) payment which
offsets part of, or exceeds, their carbon costs.
For 2022-23, the carbon price is $50 per tonne of
emissions. The federal government is to issue Climate Action Incentive
payments (CAIP) quarterly, as is done with the HST rebate. This redresses a
shortcoming in the original CAIP which was paid annually between 2018 and 2022.
The CAIPs vary by province, the composition of the household,
the size of the household, and the expected annual energy use and emissions of
the household. The payments are issued quarterly.
The size of payments vary by the number of people living in
the household: payments for a single adult (Table 9), exceeds that of the
second person (adult or first child of a single parent) in the household (Table 10), and the amounts paid for each child (Table 11).
Table
9: CAIP for a single adult (or first adult in a couple)
for 2022-23
|
Payment date
|
ON
|
MB
|
SK
|
AB
|
|
July 2022 (Double-Up)
|
$186.50
|
$208.00
|
$275.00
|
$269.50
|
|
Oct-22
|
$93.25
|
$104.00
|
$137.50
|
$134.75
|
|
Jan-23
|
$93.25
|
$104.00
|
$137.50
|
$134.75
|
|
Total
|
$373
|
$416
|
$550
|
$539
|
Table
10: CAIP for a second adult in a couple (or first
child of a single parent) for 2022-23
|
Payment date
|
ON
|
MB
|
SK
|
AB
|
|
July 2022 (Double-Up)
|
$93.00
|
$104.00
|
$137.50
|
$135.00
|
|
Oct-22
|
$46.50
|
$52.00
|
$68.75
|
$67.50
|
|
Jan-23
|
$46.50
|
$52.00
|
$68.75
|
$67.50
|
|
Total for 2022-23
|
$186
|
$208
|
$275
|
$270
|
Table
11: CAIP for each child under 18 (starting with the
second child for single parents)
for 2022-23
|
Payment date
|
ON
|
MB
|
SK
|
AB
|
|
July 2022 (Double-Up)
|
$46.50
|
$52.00
|
$69.00
|
$67.50
|
|
Oct-22
|
$23.25
|
$26.00
|
$34.50
|
$33.75
|
|
Jan-23
|
$23.25
|
$26.00
|
$34.50
|
$33.75
|
|
Total
|
$93
|
$104
|
$138
|
$135
|
The energy sources used by a household and availability of
different energy sources are not considered when determining the CAIP.
The differences in CAIP are significant, with households in
Ontario receiving the lowest payment and those in Saskatchewan, the highest (Table 12). For example, the difference in payments between the two provinces for
a two-person household is $177 and a six-person household, $446.
Table
12: CAIP by household size for 2022-23
|
Household
composition
|
Size
|
ON
|
MB
|
SK
|
AB
|
|
One adult
|
1
|
$373
|
$416
|
$550
|
$539
|
|
Two adults or one adult plus child
|
2
|
$559
|
$624
|
$825
|
$809
|
|
Two adults plus two children
|
4
|
$745
|
$832
|
$1,101
|
$1,079
|
|
Two adults plus four children
|
6
|
$931
|
$1,040
|
$1,377
|
$1,349
|
As an example, if the carbon-costs of a two-person household
in Ontario were $259, the CAIP would be $559, and the household would have a
gain of $300. However, if a different two-person household in Ontario had
carbon costs of $859, the household would experience a loss of $300.
We now compare the 2022-23 CAIPs for Ontario and
Saskatchewan with Nova Scotia's sample residential carbon costs for 2022-23.
Ontario
If Nova Scotians paid the federal carbon price on their
residential energy use and the 2022-23 Ontario-level CAIP was in effect, most
of the household combinations examined in this report would be out-of-pocket.
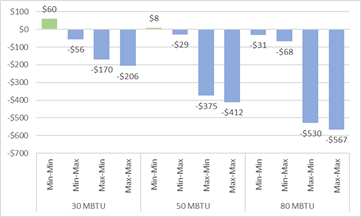
The range of impacts is shown in Figure 7. In the two-person
household, a 30 MBTU house using the most efficient heating system and DHW system
would range from a $60 gain to a loss of $567 in an 80 MBTU house using the
least efficient heating and DHW systems. The greatest losses would be in the
six-person households, with losses ranging from $407 for a 30 MBTU house with
the most efficient heating and DHW systems, to $1,108 for an 80 MBTU house with
the least efficient systems.
|
|
|
|
Two-person household
|
Four-person household
|
|
|
|
Six-person household
|
Figure
7: Impact on Nova Scotian households after
application of Ontario-level CAIP
Saskatchewan
The Saskatchewan CAIP is considerably greater than
Ontario's, so the impact on Nova Scotian households would be less with the
application of Saskatchewan's CAIP.
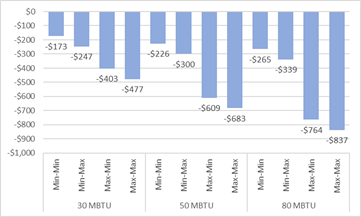
Figure 8 shows the impact of the Saskatchewan CAIP on Nova
Scotian households. Most two-person households would experience a gain of
between $60 and $326, with some households experiencing a loss ranging from $109
to $301.
As the number of people in the household increases, the
impacts of the carbon cost become more apparent, despite the CAIP. In the
four-person household scenarios, households using the most efficient heating
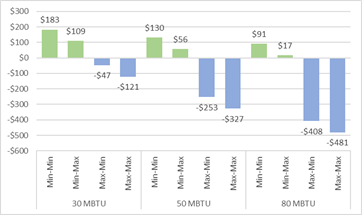
systems (Min-Min and Min-Max), receive a gain of between $17 and $183. However,
households with inefficient heating systems suffer losses of between $47 and
$481.
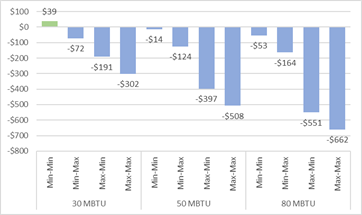
In the six-person households, except for the 30 MBTU house
using the most efficient heating and DHW systems which experience a gain of $39,
all others face a loss because of their carbon cost. The losses range from $72
to $662.
|
|
|
|
Two-person household
|
Four-person household
|
|
|
|
Six-person household
|
Figure
8: Impact on Nova Scotian households after
application of Saskatchewan-level CAIP
Discussion
The report has shown the impact of the carbon price on
different combinations of household energy systems, family sizes, and vehicle
usage. The numbers are meant to be representative. They would change in
different situations, such as the size of the house, a colder or warmer winter,
a change in the number of vehicles used by a household, driving habits,
differences in water usage, and the number and type of appliances.
The differences in provincial Climate Action Incentive payments
can be attributed to the emissions intensity of the energy systems available in
each province (see Table 13):
● 52%
of Nova Scotian households use heating oil for heating, which has a higher
emissions intensity than natural gas, which is used in 67.5% of Ontario homes
and 92.5% of Saskatchewan homes.
● Households
in all three provinces use electricity for space heating. In Ontario, 12.6%
use electricity, whereas in Nova Scotia it is 21.8%. Since Ontario relies
heavily on nuclear and hydroelectricity for its power, its emissions intensity
is 28 kg/MWh, while in Nova Scotia, which is still heavily reliant on coal for
its power, has an emissions intensity of 670 kg/MWh.
● As
with space heating, Nova Scotians rely on emissions-intensive energy sources
such as electricity (49.5%) and heating oil (47.8%) for their DHW, whereas
three-quarters of Ontario households use natural gas and 20% use low-emissions
electricity, while in Saskatchewan, DHW is almost exclusively natural gas.
● In
transportation, Nova Scotian vehicles (both cars and light trucks) are driven
greater distances than in either Saskatchewan or Ontario. This results in more
emissions per vehicle.
Table 13: Comparison of residential energy systems
(Data sources: NRCan Office of Energy Efficiency and National Inventory Report - Electricity)
|
Service
|
System
|
ON
|
SK
|
NS
|
|
Space heating systems
|
Heating oil
|
6.2%
|
3.3%
|
52.2%
|
|
Natural gas
|
67.5%
|
92.5%
|
1.7%
|
|
Electric
|
12.6%
|
5.0%
|
21.8%
|
|
Heat Pump
|
6.7%
|
2.8%
|
4.9%
|
|
Other (Propane and Coal)
|
1.1%
|
1.5%
|
1.7%
|
|
Wood
|
1.0%
|
1.8%
|
3.7%
|
|
Dual wood
|
4.9%
|
2.1%
|
14.1%
|
|
DHW heating systems
|
Electricity
|
20.4%
|
13.3%
|
49.5%
|
|
Natural Gas
|
75.1%
|
85.8%
|
0.0%
|
|
Heating Oil
|
2.8%
|
0.5%
|
47.8%
|
|
Coal and propane
|
0.7%
|
0.2%
|
0.3%
|
|
Wood
|
1.0%
|
0.2%
|
2.4%
|
|
Lighting and Appliances
|
Lighting (GJ/HH)
|
3.1
|
4.3
|
3.7
|
|
Appliances (GJ/HH)
|
11.9
|
16.1
|
15.9
|
|
Emissions intensity for electricity
(kg/MWh)
|
28
|
620
|
670
|
|
Transportation
|
Cars (km)
|
16,704
|
16,724
|
21,068
|
|
Light trucks (km)
|
17,540
|
17,475
|
22,205
|
A provincial or territorial CAIP is determined from the
carbon costs paid by those living in the region and collected by the federal
government. The energy sources available in Nova Scotia and used by Nova
Scotians should result in the federal government collecting more per household in
Nova Scotia than in other provinces. This should mean a higher CAIP for Nova
Scotian households, more in line with Saskatchewan's than Ontario's.
If this occurs, some Nova Scotians will benefit because the CAIP
exceeds their carbon costs. However, Nova Scotians whose CAIP does not cover
their carbon costs will experience a loss.
The purpose of the CAIP is to encourage individuals and
households to "take action" to either:
● Reduce
their energy consumption.
Reducing energy consumption will, depending on the
energy source, reduce emissions, and reduce the household's carbon costs.
Nova Scotia's main sources of emissions are space
heating and transportation. Energy demand for space heating and transportation
can be reduced through conservation measures such as using less energy for
space heating and driving less, respectively. Conservation measures are
typically short-term and do not address the system's underlying structural
problems. A household reducing its energy consumption might reduce energy
costs or emissions, or both, but could have health (lack of warmth during the
winter) or economic (if they are unable to get to their place of employment)
consequences.
Energy demand for space heating can also be reduced
through home retrofits; for example, adding insulation and upgrading windows.
There are programs in place to help Nova Scotians financially to reduce their
energy consumption. Households that do not meet the eligibility requirements
would be at a disadvantage.
Reducing energy demand for transportation can be
achieved by altering driving habits and following suggestions for making the
vehicle more fuel efficient. Using an alternate form of transportation is only
possible if it exists. Many Nova Scotians who live in rural areas would be at a
disadvantage; however, the CAIP recognizes this and increases the payment by
10% in certain areas of a province.
● Replace
either:
a)
The energy sources an energy system currently use to one that is less
carbon intensive, or
b)
The system that converts the energy presently used to one that is less
carbon intensive.
Solar photovoltaic panels (PVs) are an example of a
replacement action which replaces an energy source (electricity from Nova
Scotia Power) but uses the energy in the same way. Households that have taken
advantage of the province's net metering program benefit from this.
Replacing incandescent bulbs with LEDs is an example
of using a new energy system (LEDs) using the same energy source
(electricity). Similarly, replacing a gasoline vehicle with a hybrid electric
vehicle still uses gasoline, but the conversion process is different.
● Restructure
their energy use by changing both:
a)
The energy sources they use to ones that are less carbon intensive, and
b)
The system that converts the energy to use the new energy sources.
Nova Scotia Power is restructuring its energy system,
from coal and oil to an increasing reliance on renewables and natural gas.
Ideally, the financial impact of Nova Scotia Power's restructuring will be less
than the carbon price, reducing the carbon cost associated with electricity for
all Nova Scotians.
As the emissions intensity of electricity declines and
the carbon price increases, it is highly likely that Nova Scotians will
restructure their heating and DHW systems to electric, away from oil.
Some households are restructuring their transportation
system by replacing their gasoline-powered vehicle for one that is fully
electric.
Apart from energy demand reduction caused by non-monetary conservation
measures, all these actions require a household to make an expenditure which
could be beyond their means. This could lead to a positive
feedback loop, with the household unable to pay for an emissions
reduction action because the cost of the federal carbon price is increasing.
Ideally, households falling into this category would qualify for programs to
offset the cost of home energy retrofits.
However, transportation is a different matter. Provincial
governments have programs to offset part of the cost of an electric vehicle
for those who can afford an electric vehicle. However, the present lack of
both public charging infrastructure and a supply of affordable electric
vehicles will mean that Nova Scotians will continue paying the carbon costs for
their use of gasoline and other transportation fuels through no fault of their
own. Moreover, the lack of vehicle sales information from the province
makes sales and ownership difficult to determine.
There is another less discussed problem with the CAIP. As
more households reduce their emissions by reduction, replacement, or
restructuring actions, the available funds to pay the province's CAIP will
decrease. If the CAIP is not targeted at the households most affected by the
price on carbon, those less affected by it will still receive a portion of an
ever-shrinking fund.
The CAIP program attempts to address these problems by
determining the level of payments based on income: high-income households
receive less than low-income ones. This assumes that high-income households
will respond to carbon price signals by restructuring their energy use. It also
assumes that a household receiving a CAIP which exceeds its carbon costs will
put the payment into low-carbon alternatives. However, this only works if
low-carbon alternatives are both available and affordable to all households,
and households do not use the CAIP on activities other than low-carbon
alternatives.
At present, the CAIP is based on an estimate of Nova
Scotia's carbon emissions for the upcoming year. If the estimate is low (for
example, because of an unexpectedly cold winter), the carbon price could be an
unjustifiable burden on low-income households with high energy demands.
In the event a low-income household's CAIP is unable to cover
its carbon costs, a mechanism should be available to cover the losses.[3],[4] Ideally, any such
funds would come from the monies collected for the CAIP. However, it would
mean estimating an individual household's emissions:
● Any
emissions from a household using electricity to meet some combination of space
heating, DHW, and lighting and appliance needs can be determined with a fair
degree of accuracy using Nova Scotia Power's emissions intensity, since the
company knows both its energy mix and each household's electricity consumption.
● If
a record of a household's consumption of fuel oil or natural gas for space
heating or DHW is available, it can be used to estimate the household's
emissions. If, in the case of fuel oil, records are not available, an
approximation could be determined from, for example, neighbouring households,
past records, or fuel consumption data for households with similar heating
systems.
● Vehicle
emissions can be estimated from annual distance driven using past odometer readings, and the age and type
of vehicle.
The CAIP is paid in advance, based on an assumed level of
emissions for all households, regardless of the types of energy used. If
household emissions could be estimated beforehand, CAIP could be tailored to
individual households. A more difficult, but fairer and more equitable
approach.
Summary
The Nova Scotia government's protests notwithstanding, Nova
Scotians will be subject to the federal carbon pricing system starting in
2023. Based on what has happened in other provinces, a properly priced CAIP
should mean that most Nova Scotian households will not be subject to losses
because of their carbon costs. Higher-income households should not benefit
from CAIP.
Nova Scotia's high residential carbon emissions are due to
the carbon-intensive energy sources used for space heating and transportation.
As Nova Scotia Power decarbonizes, electricity will become less
emissions-intensive, making it a more attractive fuel for space heating, DHW,
and for those who can afford an electric vehicle, transportation.
Although natural gas results in the lowest emissions for
space heating and DHW, the lack of access to natural gas in most of the
province means it is unlikely it will reduce the carbon costs for many more
households than it already does.
Increasing the number of occupants in a household increases
the CAIP, but it also increases the consumption of energy. If the energy is
emissions intensive, the carbon cost of this energy could offset any potential
gains from the larger CAIP.
The report has shown that because of the high-emissions
energy sources used by Nova Scotians, the province's CAIP will need to exceed
that of Saskatchewan. It will also be necessary to ensure that large
energy-intensive households, regardless of their size, are not unduly
penalized, especially if they are low- or middle-income.
While it is understandable that the provincial government
objects to Nova Scotian households being required to pay the federal backstop carbon
price, we will be subject to it, so the province should make it a priority to
modify the CAIP so that the impact of the carbon cost does not unduly burden
low-income Nova Scotians, especially if low-emissions households continue to
benefit from it.
Acknowledgements
The author would like to thank Ryan Callaghan, Mike Shea,
and Sandy Cook for their comments and suggestions on earlier versions of the
report.