The Inverted Block Rate as an alternative to Nova Scotia Power's Domestic Service Tariff
Larry Hughes, PhD
Dalhousie University
5 December 2022
Abstract
Coal and natural gas are responsible for over half of the world's electricity production. Since energy providers must recovery their costs, the rise in the prices of these fuels over the past year is having a commensurate impact on the price of electricity to the customer.
How an energy provider recovers these costs is determined by the billing method used. Two of the most common are the flat rate, in which the customer pays a constant price per kilowatt-hour for the energy consumed, and the time-of-use rate, which has a varying price determined by the season, day, and time-of-day.
Another billing method is the block rate, in which the cost-per-kilowatt-hour is determined by the volume of energy consumed by the customer. Consumption is divided into blocks, each one with its own price and size. The cost per block can either decrease (a declining block rate) or increase (an increasing or inverted block rate) as a customer's consumption rises.
In this paper we examine an application of the inverted block rate to Nova Scotia Power's residential customers. We show how a revenue neutral block rate can be derived from an existing flat rate (a Domestic Service Tariff). A total of nine block-rate scenarios are proposed and discussed. The paper concludes that for the block rate to be successful, other rate classes must be available for high consumption customers and low- and moderate-income high-volume customers may still require financial assistance.
1 Introduction
The availability of an affordable supply of electricity is essential to the development and well-being of all modern societies. Since electricity does not exist naturally in a form that can be readily used, it is necessary to generate electricity from other sources of energy; for example, in 2021, the world's electricity demand was met by coal (36%), natural gas (23.1%), hydroelectric (15.3%), nuclear (9.8%), wind (6.6%), and other sources (9.2%) (IEA, 2022).
Once the electricity has been generated, the energy supplier sells the electricity to its customers.[1] Revenue from the sale of electricity must allow the energy supplier to (Skrotzki & Vopat, 1990):
• Recover the cost of capital investments (generating equipment, transmission and distribution equipment, and other operating equipment).
• Recover the cost of operation, supplies, and maintenance of the equipment.
• Recover the cost of metering equipment, billing and collection costs, and miscellaneous services.
• Allow a satisfactory rate of return on the capital investment.
Obtaining revenue from customers (that is, billing) requires the energy supplier to measure each customer's energy consumption, and in some cases demand, over a given billing period using some form of metering equipment.[2] The customer's bill is then determined from this information and the rate model associated with the customer's rate class.
At a minimum, a rate model is a means of generating revenue from customers. However, rate models can do far more than this. If judiciously applied, they can influence customer consumption patterns by rewarding changes in behaviour. For example, many energy suppliers employ rate models that encourage consumption by decreasing the price per unit of energy as consumption increases (Patterson, 1999).
However, with increasing fuel prices and growing environmental concerns over methods of electrical generation, some energy suppliers, either through shareholder pressure or government legislation, are being forced to reconsider their business strategies. These new strategies often focus on demand reduction by modifying customer habits (for example, implementing Demand Side Management (DSM) programs that encourage reductions in demand, or energy consumption, or both) and system restructuring by replacing existing thermal generation with a combination of variable-renewables supported by lower-emissions natural gas (Hughes & de Jong, 2021).
There are many approaches to DSM, including education, electronic monitoring devices, and changes in energy prices or price-signaling (Gellings & Parmenter, 2016). One approach to price signaling is to employ interval (or smart) meters which can measure and record energy consumption at specific times throughout the day. These meters allow the energy supplier to charge higher prices at times of high system-wide (i.e., peak) consumption when energy is generated from expensive fuel sources; the objective of this price signal is to encourage the consumer to reduce consumption during these periods (Nicolson, Fell, & Huebner, 2018).
While many energy suppliers are replacing existing induction meter technologies (which simply record total energy consumption) with newer interval metering technologies, some suppliers or customers prefer to use existing billing models. The most widely used being the flat rate model which applies the same price per unit of energy to all energy consumed, are not conducive to DSM programs, can result in some customers cross-subsidizing others, and do not address the problem of peak consumption. However, other rate models, such as the block rate, can overcome the limitations of the flat rate model while using either induction meters or interval meters.
In block-rate billing, customer energy consumption is divided into two or more blocks. The energy consumed in the first block is charged at a different rate than that in subsequent blocks. In a declining block-rate, each block is charged less than the preceding block, whereas in an increasing or inverted block-rate, each block is charged more than the preceding block. The final or tail-block has no upper consumption limit. The flat rate is a block-rate model with a single block.
Block rates are not limited to energy consumption. In parts of the United States, the availability and supply of potable water has become a problem because of falling water tables, growing populations, lack of freshwater supplies, and increased environmental awareness (Postel, 2017). The inverted block rate model has been identified by public utilities as a means of sending a water conservation signal to consumers through increased prices for increased usage in a variety of cities in the United States, including Riverside County in California (EMWD, 2021), Colorado Springs (CSU, n.d.), and Tucson, Arizona (Tucson, 2020).
When energy suppliers use inverted-block rates, the electricity bill is calculated using a low-cost first block, with an increasing rate assigned to each subsequent block, ending with the tail-block rate being the highest.
In Vermont, the Burlington Electric Department has a two-block inverted block rate for residential customers: the first 100 kWh is charged $0.116173/kWh, and energy consumed beyond the first 100 kWh is charged $0.158815/kWh (BED, 2021).
The California Public Utilities Commission requires the state's energy suppliers to use either a tiered (i.e., block) or a time-of-use rate for its residential and small commercial customers (CPUC, 2021). There are three tiers; the lowest tier is the baseline (the rate depends on where the customer lives in the state and the time of year, either winter or summer), any electricity consumed beyond the baseline is charged the second-tier rate, and consumption exceeding four-times the baseline rate is subject to a high-usage charge. For example, PG&E's baseline usage rate is $0.31516/kWh, the second-tier consumption rate is $0.39468/kWh, and the high usage rate is $0.49335/kWh (PG&E, 2022).
Block rates are used by Canadian energy suppliers. Ontario has a seasonal (winter or summer) two-tier rate structure. In the winter months, customers are charged $0.0870/kWh for their first 1,000 kWh/month and $0.1030/kWh for each additional kilowatt-hour; the summer rates are the same, except that the first block limit is 600 kWh/month (OEB, 2022). Customers can switch from time-of-use billing to tiered.
FortisBC has a two-tier system, with the first 1,600 kWh charged $0.12365/kWh and any additional kilowatt-hours charged at $0.13713/kWh (FortisBC, 2022b). Opposition to the two-tier system will see FortisBC returning to flat-rate billing by 2023 (FortisBC, 2022a; Potenteau, 2019; UBCM, 2013).
In Prince Edward Island, Maritime Electric has a declining block-rate for residential customers: the first 2,000 kWh are charged $0.1532/kWh, with the balance being charged $0.1228/kWh (Maritime Electric, 2022).
At present, Nova Scotia Power, the major energy provider in Nova Scotia, offers its residential customers the choice of either a flat rate or a time-of-use rate. In this paper, we examine three revenue-neutral two-block system scenarios using different first-block rates and sizes for Nova Scotia Power.
The need to reduce the impact of rising energy prices (for heat and electrical services) on low-income households is apparent from Figure 1 which shows the percent of average household income spent on energy in Nova Scotia and Canada in 2019. Not only did Nova Scotians spend more on household energy (because of their reliance on fuel oil for heating and high electricity costs), but those in the lowest economic quintile spent more than twice as much on energy, 5.3%, than did the highest-quintile Nova Scotians, 2.4%.
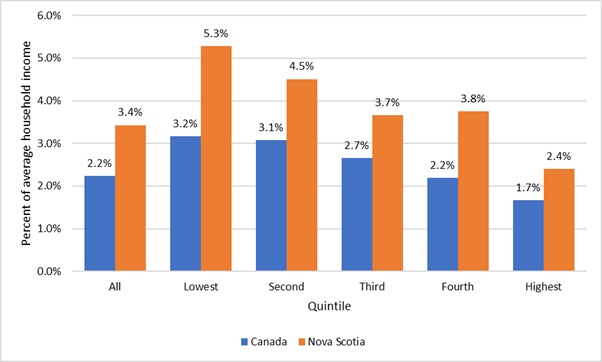
Figure 1: Percent of average household
income spent on energy in Canada and Nova Scotia in 2019
by quintile (data from (Statistics Canada, 2021))
In the next section, a brief introduction to rate models and the changes they have undergone because of the evolution of metering technology is given. This section includes an examination of the inverted block rate tariff. The third section discusses the methods used in this research and briefly examine the available data supplied by Nova Scotia Power. The application and results of the two-block model using different block rates and sizes are presented in the fourth section. The pros and cons of the proposed block rate and possible applications of it in the province are discussed in the fifth section. The paper ends with a summary of the work.
2 Rate models
Although the price of a unit of energy paid by a customer depends upon the customer class and rate model, the basic rate model equation is (Skrotzki & Vopat, 1990):
y = d×x + e×z + c
where, for each billing period during which energy was consumed:
y - total amount of bill (e.g., dollars).
d - unit charge for maximum demand (e.g., dollars/kilowatt).
x - maximum demand (e.g., kilowatts).
e - unit charge (or price) for energy (e.g., dollars/kilowatt-hour).
z - total energy consumed (e.g., kilowatt-hours).
c - constant charge (e.g., dollars).
To bill a customer, it is necessary to have metering equipment that can measure and record the maximum demand, x, or the total energy consumed, z, or both.
2.1 Meters and rate structures
Electricity rate structures depend on the data collected by the metering system.
At its simplest, the meter records the energy consumed throughout the billing period and the customer is charged for the energy consumed (Skrotzki & Vopat, 1990). This is the flat rate model (also referred to as the uniform rate, straight meter rate, and the single rate) using induction-type electricity meters (or Ferraris meters) that record energy consumption only, or interval or "smart" meters which record the consumption and time of consumption (Panda & Das, 2021). The cost to the customer is simply:
y = e × z + c
This model is widely used by energy suppliers when billing their residential customers. The model is easily understood by customers as it applies a known price, e, to a given amount of energy, z. The charge, c, allows the energy supplier to recover miscellaneous expenses.
Time-of-use (often referred to as smart) meters can also measure intervals (see above), although in most applications only energy and the time the energy is consumed are recorded. In these cases, the total charge is a variation on the above equation (Skrotzki & Vopat, 1990):
t = ∑ et × zt + c
where et is the price of a unit of energy and zt is the total energy consumed at time interval t. These rate models allow the energy supplier to vary the rate based upon the season, day-of-week, or time-of-day, once again, potentially becoming cost reflective. This rate model can incorporate price signals that are intended to encourage various consumption patterns by applying different rates at different times.
Other rate models exist for industrial customers, but require multiple meters, one to record the energy and the other to record the maximum demand during the billing period. Perhaps the best known of these is the Hopkinson rate which uses demand and energy consumption data, allowing the energy supplier to create a variety of price signals, ideally making the price cost reflective (Veall, 1983).
2.2 The flat rate
Most of Nova Scotia Power's residential customers are billed using the flat rate. Despite this, the flat rate's simplicity belies several limitations, including (Simshauser & Downer, 2016):
• It restricts the energy supplier's ability to create meaningful price signals.
• It can result in cross-subsidies from customers with demands that are not peak-coincident to those with demands that are peak-coincident.
2.2.1 Price signals
In the flat rate, all customers pay the same price for a unit of energy, regardless of consumption. With only a single price, the energy supplier has few means available to influence customers' consumption patterns. Any change in price affects all customers; for example, raising rates to discourage consumption impacts all customers, including those with existing low levels of consumption.
2.2.2 Cross-subsidies
The cost of energy generation varies by season, day-of-the-week, and the time-of-day. In periods of low demand (usually midnight to 6h), when most, if not all, demand is met by baseload generation, the cost of generating a unit of energy is typically the lowest. On the other hand, when demand is high (often in the early evening), the energy supplier can use more expensive fuels, resulting in the highest cost for energy generation.
Since the flat rate charges a customer only for the energy consumed, not the demand, the unit price must be a 'blend' of the different costs of generation. The flat rate model implies that all customers exhibit the same consumption profile; in other words, a customer's energy consumption is assumed to be proportional to the demand they put on the system (IPRT, 2003).
Experience shows this is not always the case: a customer's maximum demand is not necessarily coincident with the system peak, meaning that the cost of generation can vary between customers.
For example, consider two customers in the same rate class paying the same price per unit of energy, with the first consuming 240 kilowatt-hours a day, and the second consuming 400 kilowatt-hours. The customer's hourly demand throughout the day is shown in Figure 2.
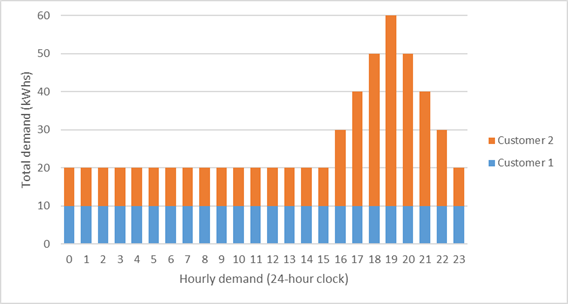
Figure 2: Flat-rate cross-subsidy example
The first customer's demand is a constant 10 kilowatts per hour as is the second customer's until 16h, when it starts to rise, peaking at 50 kilowatts at 18h. The non-peak hourly demand between 0h and 15h and 23h is 20 kilowatts (split evenly between the two customers), while the peak demand is 60 kilowatts (10 kilowatts for the first customer and 50 for the second) occurring between 17h and 19h. The customer's price per unit of energy is obtained, in part, from the costs associated with the different types of generation. If the energy supplier meets the non-peak demand with low-cost, base-load energy and the system peak with a combination of baseload and expensive peak load energy, the price per unit of energy is a combination of the two.
Although both customers pay the same price per unit of energy, the first customer pays disproportionately more per unit because the second customer consumes more energy generated during the (expensive) system peak. In short, one finds that:
• Customers with a large portion of their demand that is not coincident with the system peak are overcharged for the price of a unit of energy.
• Customers with a large portion of their demand that is coincident with the system peak are undercharged for the price of a unit of energy.
In other words, the flat rate structure does not reflect the cost of generation and can result in cross-subsidies. The effect of this on customers is highlighted in Table 1.
Table 1: Potential cross-subsidy effect of the flat-rate model
|
|
Demand during system peak |
|
|
|
Disproportionally lower than peak |
Disproportionally higher than peak |
|
Small customer |
Paying too much |
Paying too little |
|
Large customer |
Paying too much |
Paying too little |
2.3 Alternatives to the flat rate
There is a wide variety of electricity consumption meters available which can record energy consumption and time-of-consumption. Although these meters are intended for time-of-use rates, if the time component is ignored, the result is a customer's energy consumption. This value can be used with a flat-rate tariff.
Electricity providers are not restricted to the flat rate since other rate models are available, notably the step meter rate and the block meter rate (Skrotzki & Vopat, 1990).
2.3.1 Step meter rate
The step meter rate charges customers using a 'sliding scale', where the rate is determined by the volume of energy consumed, as shown in Table 2.
Table
2: Step meter rate example
(z is volume consumed (kWh); p, q, and r are the volume limits (kWh); and
e1, e2, and e3 are the rates for distinct levels of consumption
|
Volume
|
Rate ($/kWh) |
Charges |
|
0 ≤ z ≤ p |
e1 |
y = e1 × z + c |
|
p < z ≤ q |
e2 |
y = e2 × z + c |
|
q < z ≤ r |
e3 |
y = e3 × z + c |
The step meter rate exhibits problems at the energy consumption limits (p, q, and r). If the energy provider decreases the rate (e1, e2, and e3) as the demand volume increases, a customer with energy consumption slightly below a limit may gain significant savings simply by increasing consumption slightly above the limit. The step rate model can be modified to handle this problem, at the expense of the added complexity of the block meter rate.
2.3.2 Block meter rate
The block meter rate divides a customer's total energy consumption into one or more blocks, with each block assigned its own price.
In the block meter rate, the total energy consumption, z, is divided into two or more block limits (z1, z2, ..., zn, specifying the maximum size of the block):
z = z1 + z2 + … + zn
Each block is assigned its own price: e1, e2, …, en. The block meter rate can then be expressed as:
y = e1×z1 + e2×z2 + … + en × zn + c
For example, if a customer's energy consumption, z, fell into the second block, the total charge would be the volume consumed in the first block (z1) and the volume consumed in the second block (z2, or z - z1):
y = e1×z1 + e2×z2 + c
In the block meter rate, the customer's bill is created by dividing the consumption into a series of blocks and then applying a price to each block, while in the step meter rate, a single price is applied to the customer's total energy consumption, depending upon the level of consumption.
Both the step and the block meter rates were originally designed to work with declining prices; that is, the more energy consumed by a customer, the less the price per unit of energy (in other words, en > en+1). Declining energy prices are intended to reflect the fact that increased generation spreads the fixed charges over a greater number of units of energy, meaning that the price of energy should decrease as consumption increases (Skrotzki & Vopat, 1990). With rising fuel prices and growing environmental concerns over the ways in which energy is produced, many people are questioning the wisdom of creating price signals that encourage the consumption of energy.
2.4 The Inverted Block Rate
Block rates need not have a declining price structure; if the block rate increases with increasing energy consumption (that is, en < eb), the block rate is said to be an inverted (or increasing or inclining) block rate (Borenstein, 2008). The inverted block rate is different from the flat rate in that it allows the energy supplier to introduce price signals, thereby rewarding customers for reducing consumption and reducing the impact of cross-subsidies.
2.4.1 Creating an inverted block rate
Energy suppliers must develop rate structures that generate sufficient revenues to recover costs and give a satisfactory rate of return. When developing a rate structure for an inverted block rate for a given customer class, the energy supplier must determine:
• The revenue to be generated from the customer class.
• The number of blocks.
• The energy consumption limits associated with each block.
• The price associated with each block.
The selection of the blocks, the limits, and the prices allows the energy supplier to employ price signals that can encourage changes to customer energy consumption habits.
The number of blocks chosen can have an impact on the rate structure, its usefulness, and possible acceptance:
• An n-block structure has n-1 limits. A block's limit indicates the maximum energy consumption for the block. The tail block has no consumption limit.
• Each block is associated with one or more customers. The first block contains all customers. Block n contains the customers with consumption greater than block n-1's limit.
• A single block is simply a flat rate model in which there is a single price per unit of energy that is common to all customers and being only one block, there is no upper limit.
• Unless care is taken, the blocks and limits can be manipulated to produce results like the flat rate. For example, in a two-block structure (i.e., with a single limit), the first-block size could be made very low (with few customers with consumptions below the limit) or very high (with few customers with consumptions above the limit). In either case, it means that most customers pay the same price per unit of energy.
2.5 Nova Scotia Power's energy-meter rate classes
Nova Scotia Power has four Domestic rate classes that operate with an energy-meter only (as opposed to an energy and a demand meter) (NSP, 2022):
• The Domestic Service Tariff, which charges $0.16215/kWh and has a monthly connection charge of $10.83. This tariff is a flat rate.
• The Domestic Service Time-of-Day Tariff has a winter months tariff (December to February) for when demand is greatest and a non-winter months tariff (March to November). The tariff is applicable only to households using Electric Thermal Storage (ETS) or in-floor radiant heating systems. The different rates and when they are applied are shown in Table 3. The monthly customer charge is $18.82 per month.
Table 3: Nova Scotia Power's Electric-Heating Time-of-Day Tariff (price per kilowatt-hour)
|
March to November |
|||||
|
7:00 am to noon |
Noon to 4:00 pm |
4:00 pm to 11:00 pm |
11:00 pm to 7:00 am |
7:00 am to 11:00 pm |
11:00 pm to 7:00 am |
|
$0.20573 |
$0.16215 |
$0.20573 |
$0.09288 |
$0.16215 |
$0.09288 |
|
Weekends and Holidays are $0.09288 throughout the year |
|||||
• The Domestic Service Peak Pricing Tariff which charges $0.13189/kWh except when a "Critical Peak Event"b occurs during the five months between 1 November and 31 March between the times of 7:00 am and 11:00 am and 5:00 pm and 11:00 pm. Electricity used during a Critical Peak Event is charged $1.50000/kWh. Customers are given advanced warning of an upcoming event. The customer charge is $10.83 per month.
• A second Domestic Service Time-of-Use Tariff is available for those customers who do not use one of the approved electric heating systems (see above, Time-of-Day tariff) and is approved by Nova Scotia Power; the times and rates are shown in Table 4. The monthly customer charge is $10.83.
Table 4: Nova Scotia Power's Non-Electric-Heating Time-of-Use Tariff (price per kilowatt-hour)
|
1 November to 31 March |
1 April to 31 October |
|||
|
7:00 am to 11:00 am |
11:00 am to 5:00 pm |
5:00 pm to 9:00 pm |
9:00 pm to 7:00 am |
|
|
$0.32429 |
$0.16215 |
$0.32429 |
$0.16215 |
$0.10651 |
Nova Scotia Power also has a declining block rate, the Small General Tariff, typically intended for small businesses. The first 200 kWh per month are charged $0.16483/kWh and $0.14669/kWh for each kilowatt-hour about 200 kWh.
3 Methods and Data
In this section a method is developed which determines the tail-block rate for an energy provider. The section also examines Nova Scotia Power's 2019 residential data.
3.1 Methods
3.1.1 Determining the tail-block rate
Each scenario is designed so that the energy provider's revenue from the customer grouping using the flat-rate tariff remains unchanged. This requires the total revenue from first-block sales and tail-block sales to equal the revenue from the original flat-rate tariff. Consequently, the tail-block rate is always more than the original flat-rate.
The steps used to determine the tail-block price are as follows:
1. Determine the volume of kilowatt-hours sold in the first block (from each customer's consumption). If the consumption is less than the first-block size, then the customer's first-block volume is the volume consumed, otherwise it exceeds the first-block size, so only the volume is the first-block size:
FirstBlockkWh = ∑ IF Consumption < FirstBlockSize THEN Consumption ELSE FirstBlockSize
2. Calculate the first-block revenue:
FirstBlockRevenue = FirstBlockkWh × FirstBlockRate
3. Determine the tail-block volume from the total consumption and first-block volume:
TailBlockkWh = Consumption - FirstBlockkWh
4. Calculate the required tail-block revenue:
TailBlockRevenue = FlatRateRevenue - FirstBlockRevenue
5. The tail-block rate ($/kWh):
|
|
TailBlockRate = |
TailBlockRevenue |
|
||
|
|
TailBlockkWh |
|
|||
|
|
|
|
|||
3.1.2 The combined rate
In the flat-rate tariff, the cost-per-kilowatt-hour remains constant, regardless of the quantity of electricity the customer consumes.
In the block rate, consumption up to the first-block size is a flat rate (the first-block rate). When a customer's consumption exceeds the first-block size the customer pays the tail-block rate for each additional kilowatt-hour and the kilowatt-hour cost becomes a combination of the first- and tail-block rates, causing it to rise. Thereafter, the rate is a function of the consumption, with the influence of the tail-block rate changing as the consumption changes:
IF Consumption < FirstBlockSize THEN
CombinedCost = Consumption × FirstBlockRate
ELSE
TailBlockkWh = Consumption - FirstBlockSize
CombinedCost = FirstBlockkWh ×FirstBlockRate + TailBlockkWh × TailBlockRate
END
The tail-block size is the volume of electricity the customer consumes in the tail block.
The customer with the highest consumption has the maximum kilowatt-hour cost. Regardless of the first-block rate and the first-block size, the maximum cost will always be less than the tail-block rate.
3.1.3 Customers paying less than the flat-rate tariff
The level of consumption a customer must exceed to start paying more than the energy provider's flat-rate tariff occurs when the combined costs of the first- and tail-block rates are equal to the flat-rate tariff and the following equation is true:
|
FlatRateTariff = |
FirstBlockkWh×FirstBlockRate + TailBlockkWh ×TailBlockRate |
|
|
FirstBlockkWh +TailBlockkWh |
||
By rearranging the equation, the tail-block size satisfying the above equation is:
|
|
TailBlockSize = FirstBlockkWh × |
FlatRateTariff - FirstBlockRate |
|
|
TailBlockRate - FlatRateTariff |
The level of consumption at which the customer would be paying the flat-rate tariff is the sum of the first-and tail-block sizes, or:
|
|
Consumption = FirstBlockSize × (1+ |
FlatRateTariff - FirstBlockRate |
) |
|
TailBlockRate - FlatRateTariff |
The point at which a customer pays no more than the flat-rate tariff is determined by the first-block size and is constant for that block size, regardless of the first-block rate.
3.2 Nova Scotia Power Data
In 2019, Nova Scotia Power had 438,880 residential customers paying the Domestic Tariff rate. Ten percent of these customers (43,888 customers) consumed a maximum of 116.6 kWh per month, while the top 1% (4,389 customers) consumed between 4,260 and 38,490.5 kWh per month. Half of its residential customers consumed 660.3 kWh per month or less, and 90% of Nova Scotia Power's customers used less than 2,004.3 kWh per month. The highest monthly consumption was 38,490.5 kWh (see Table 5).
Table
5: Average monthly residential electricity consumption in 2019
(Data from Table 13)
|
Percentile |
Maximum Consumption (kWh) |
Number of customers |
Cumulative number of customers |
|
10% |
116.6 |
43,888 |
43,888 |
|
20% |
248.5 |
43,888 |
87,776 |
|
30% |
379.5 |
43,888 |
131,664 |
|
40% |
514.1 |
43,888 |
175,552 |
|
50% |
660.3 |
43,888 |
219,440 |
|
60% |
834.7 |
43,888 |
263,328 |
|
70% |
1,056.3 |
43,888 |
307,216 |
|
80% |
1,378.1 |
43,888 |
351,104 |
|
90% |
2,004.3 |
43,888 |
394,992 |
|
95% |
2,726.9 |
21,944 |
416,936 |
|
99% |
4,260.3 |
17,555 |
434,491 |
|
100% |
38,490.5 |
4,389 |
438,880 |
Nova Scotia Power's total monthly sales in 2019 averaged 422.72 GWh (see Table 13), generating a revenue from the Domestic Tariff of $68.5 million per month.
4 Scenarios
In the following section, the effects of adopting different combinations of first-block sizes (250 kWh, 500 kWh, and 1000 kWh) and first-block rates (65%, 80%, and 95% of Nova Scotia Power's 2019 Domestic Tariff of $0.16215 per kilowatt-hour, or FBR65, FBR80, and FBR95, respectively) on Nova Scotia Power's residential customers are examined. Each scenario applies the three first-block rates to one of the first-block sizes. The tail-block rates are different for each first-block size and rate.
4.1 Scenario 1: First-block size: 250 kWh
In the first scenario, the first-block rates (FBR65, FBR80, and FBR95) are applied to a first-block size of 250 kWh. The tail-block rates are derived from each first-block rate and the first-block size and are shown in Table 6.
Table 6: First- and tail-block rates for first-block size of 250 kWh
|
Fraction of Domestic Tariff |
First-block rate |
Tail-block rate |
|
65% (FBR65) |
$0.10540 |
$0.18003 |
|
80% (FBR80) |
$0.12972 |
$0.17237 |
|
95% (FBR95) |
$0.15404 |
$0.16470 |
The impact of the three combined rate structures on Nova Scotia Power's residential customer groups (see Table 13) is shown in Figure 3. In all three cases, about 71% of the customers will pay less than the existing Domestic Tariff if they consume less than 1,044 kWh/month; for consumers using less than 250 kWh/month, the reductions range from $0.05675 (FBR65) and $0.00811 (FBR95). The remaining 29% of customers have a combined rate exceeding the Domestic Tariff; the highest combined rate exceeds the Domestic Tariff by $0.01788 (FBR65) and $0.00255 (FBR95).
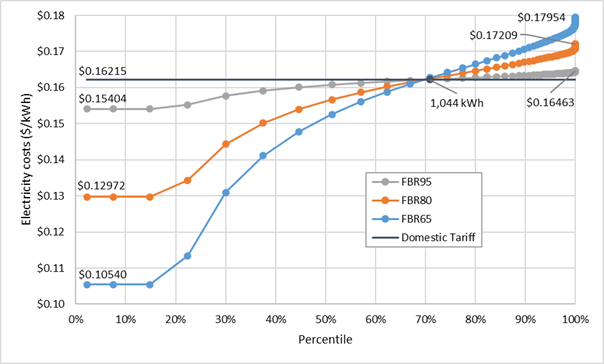
Figure 3: Combined electricity rates ($/kWh) with 250 kWh first-block
The effect of the block rates on different levels of consumption and rates is shown in Table 7. At low consumption levels, the greatest cost reductions occur with the 65% rate. For example, consuming 379.5 kWh has a Domestic Tariff cost of $61.54, whereas it is $49.66 at 65% (a reduction of $11.87) and $59.84 at the 95% rate (a reduction of $1.70).
The benefits of the 65% rate are reversed when consumption exceeds 1,044 kWh. For example, the Domestic Tariff for consuming 4,260.3 kWh is $690.81; at 65% it is $748.32 (an increase of $57.51 over the Domestic Tariff), and at 95% it is $699.02 (an increase of $8.22). The tail-block rates are higher to offset the lower first-block rate.
Table 7: Sample costs for different consumptions and the Domestic Tariff
|
Percentile |
kWh consumed |
Domestic Tariff cost |
Consumption cost |
Cost vs. Domestic Tariff |
||||
|
FBR65 |
FBR80 |
FBR95 |
FBR65 |
FBR80 |
FBR95 |
|||
|
10% |
116.6 |
$18.91 |
$12.29 |
$15.13 |
$17.96 |
-$6.62 |
-$3.78 |
-$0.95 |
|
20% |
248.5 |
$40.29 |
$26.19 |
$32.24 |
$38.28 |
-$14.10 |
-$8.06 |
-$2.01 |
|
30% |
379.5 |
$61.54 |
$49.66 |
$54.75 |
$59.84 |
-$11.87 |
-$6.78 |
-$1.70 |
|
40% |
514.1 |
$83.36 |
$73.90 |
$77.95 |
$82.01 |
-$9.47 |
-$5.41 |
-$1.35 |
|
50% |
660.3 |
$107.07 |
$100.22 |
$103.15 |
$106.09 |
-$6.85 |
-$3.92 |
-$0.98 |
|
60% |
834.7 |
$135.35 |
$131.61 |
$133.21 |
$134.81 |
-$3.73 |
-$2.13 |
-$0.53 |
|
70% |
1,056.3 |
$171.28 |
$171.51 |
$171.41 |
$171.31 |
$0.23 |
$0.13 |
$0.03 |
|
80% |
1,378.1 |
$223.46 |
$229.44 |
$226.88 |
$224.31 |
$5.98 |
$3.42 |
$0.85 |
|
90% |
2,004.3 |
$325.00 |
$342.17 |
$334.81 |
$327.45 |
$17.18 |
$9.82 |
$2.45 |
|
95% |
2,726.9 |
$442.17 |
$472.26 |
$459.37 |
$446.47 |
$30.10 |
$17.20 |
$4.30 |
|
99% |
4,260.3 |
$690.81 |
$748.32 |
$723.67 |
$699.02 |
$57.51 |
$32.86 |
$8.22 |
|
100% |
38,490.5 |
$6,241.23 |
$6,910.76 |
$6,623.82 |
$6,336.88 |
$669.53 |
$382.59 |
$95.65 |
The new cost-per-kilowatt hour for the highest consumption customer would be 1.5%, 6.1%, and 10.7% above the Domestic Tariff for the FBR95, FBR80, and FBR65 rates, respectively; at 95%, the rate would be 1.0%, 3,9%, and 6.8% above.
4.2 Scenario 2: First block size: 500 kWh
The first-block size in the second scenario is 500 kWh. The tail-block rates for this block size and each first-block rate are summarized in Table 8. The difference between the first- and tail-block rates illustrates the effect of the first-block size and the combined rate. FBR65 has a difference of $0.09996 (which is almost twice the first-block rate), whereas the FBR95 rate is only $0.01428.
Table 8: First- and tail-block rates for first-block size of 500 kWh
|
Fraction of Domestic Tariff |
First-block rate |
Tail-block rate |
|
65% (FBR65) |
$0.10540 |
$0.20536 |
|
80% (FBR80) |
$0.12972 |
$0.18684 |
|
95% (FBR95) |
$0.15404 |
$0.16832 |
The electricity prices for the 500-kWh block size and the three combined rates are shown in Figure 4. The combined rate for the estimated 323,125 of the customers (73.6%) consuming less than 1,157 kWh per month is less than the Domestic Tariff rate. Consequently, the 26.4% of the customers consuming more would pay more than the Domestic Tariff rate; the amount paid would depend on the first-block rate. For example, customers with FBR80 would pay up to $0.18610 per kilowatt-hour.
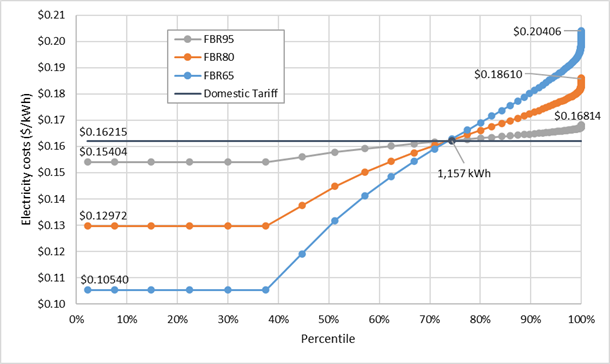
Figure 4: Combined electricity prices ($/kWh) with 500 kWh first-block
The impact of the 500 kWh first-block size on Nova Scotia Power's customers is shown in Table 9. Since customers benefit from the increased block size, the cost to higher volume customers increases to ensure the revenue generated from any of the combined rates is the same as the revenue generated from the Domestic Tariff. For example, the cost to a customer consuming 660.3 kWh would be $107.07 under the Domestic Tariff, but fall to $85.62 in the FBR65, a reduction of $21.45; however, a customer consuming 2,726.9 kWh would pay $67.85 more at the same rate.
Table 9: Sample costs for different consumptions and the Domestic Tariff
|
Percentile |
kWh consumed |
Domestic Tariff |
Consumption cost |
Cost vs. Domestic tariff |
||||
|
FBR65 |
FBR80 |
FBR95 |
FBR65 |
FBR80 |
FBR95 |
|||
|
10% |
116.6 |
$18.91 |
$12.29 |
$15.13 |
$17.96 |
-$6.62 |
-$3.78 |
-$0.95 |
|
20% |
248.5 |
$40.29 |
$26.19 |
$32.24 |
$38.28 |
-$14.10 |
-$8.06 |
-$2.01 |
|
30% |
379.5 |
$61.54 |
$40.00 |
$49.23 |
$58.46 |
-$21.54 |
-$12.31 |
-$3.08 |
|
40% |
514.1 |
$83.36 |
$55.59 |
$67.49 |
$79.39 |
-$27.77 |
-$15.87 |
-$3.97 |
|
50% |
660.3 |
$107.07 |
$85.62 |
$94.81 |
$104.00 |
-$21.45 |
-$12.26 |
-$3.06 |
|
60% |
834.7 |
$135.35 |
$121.43 |
$127.40 |
$133.36 |
-$13.91 |
-$7.95 |
-$1.99 |
|
70% |
1,056.3 |
$171.28 |
$166.94 |
$168.80 |
$170.66 |
-$4.34 |
-$2.48 |
-$0.62 |
|
80% |
1,378.1 |
$223.46 |
$233.02 |
$228.92 |
$224.83 |
$9.57 |
$5.47 |
$1.37 |
|
90% |
2,004.3 |
$325.00 |
$361.62 |
$345.92 |
$330.23 |
$36.62 |
$20.93 |
$5.23 |
|
95% |
2,726.9 |
$442.17 |
$510.01 |
$480.94 |
$451.86 |
$67.85 |
$38.77 |
$9.69 |
|
99% |
4,260.3 |
$690.81 |
$824.91 |
$767.44 |
$709.97 |
$134.10 |
$76.63 |
$19.16 |
|
100% |
38,490.5 |
$6,241.23 |
$7,854.39 |
$7,163.04 |
$6,471.69 |
$1,613.16 |
$921.80 |
$230.45 |
In this scenario, the new rate for high-consumption customers in the 99th percentile, when compared to the Domestic Tariff, ranges from 2.8% to 11.1%, to 19.4%, for FBR95, FBR80, and FBR65. In the 95th percentile, it ranges from 2.2% to 15.3%.
4.3 Scenario 3: First block size: 1000 kWh
In the final scenario, the first block size is 1,000 kWh, meaning that about two-thirds of Nova Scotia Power's customers pay no more than the first-block rate. The first-block rate and size determine the tail-block rate. The 1,000 kWh first block size means the difference between the Domestic Tariff and the tail-block rates is larger than in the other scenarios (see Table 10).
Table 10: First- and tail-block rates for first-block size of 1000 kWh
|
Fraction of Domestic Tariff |
First-block rate |
Tail-block rate |
|
65% (FBR65) |
$0.10540 |
$0.28413 |
|
80% (FBR80) |
$0.12972 |
$0.23185 |
|
95% (FBR95) |
$0.15404 |
$0.17958 |
The size of the first block means those consuming 1,465 kWh/month, or less about 82% of Nova Scotia Power's customers, pay no more than the Domestic Tariff rate of $0.16215/kWh (see Figure 5). The remaining 18% of Nova Scotia Power's customers pay a higher combined rate, the value of which is determined by their monthly average consumption.
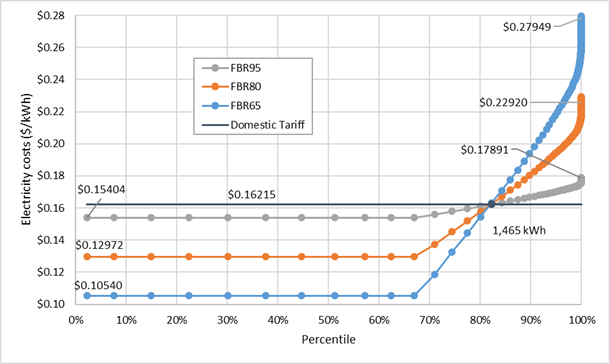
Figure 5: Combined electricity prices ($/kWh) with 1,000 kWh first block
Table 11 shows the results of applying the different rates when using a 1,000 kWh first block. The considerable savings made by those consuming less than 1,465 kWh is apparent; for example, at 1056.3 kWh, customers can save between $7.13 at FBR95 and $49.88 at FBR65. However, at larger consumptions, customers pay considerably more; a customer consuming 4,260.3 kWh, the FBR65 customer pays an additional $340.95, while at FBR95, the customer pays $48.71 more than with the Domestic Tariff.
Table 11: Sample charges for different consumptions and the Domestic Tariff
|
Percentile |
kWh consumed |
Domestic Tariff |
Consumption cost |
Cost vs. Domestic Tariff |
||||
|
FBR65 |
FBR80 |
FBR95 |
FBR65 |
FBR80 |
FBR95 |
|||
|
10% |
116.6 |
$18.91 |
$12.29 |
$15.13 |
$17.96 |
-$6.62 |
-$3.78 |
-$0.95 |
|
20% |
248.5 |
$40.29 |
$26.19 |
$32.24 |
$38.28 |
-$14.10 |
-$8.06 |
-$2.01 |
|
30% |
379.5 |
$61.54 |
$40.00 |
$49.23 |
$58.46 |
-$21.54 |
-$12.31 |
-$3.08 |
|
40% |
514.1 |
$83.36 |
$54.18 |
$66.69 |
$79.19 |
-$29.18 |
-$16.67 |
-$4.17 |
|
50% |
660.3 |
$107.07 |
$69.59 |
$85.65 |
$101.71 |
-$37.47 |
-$21.41 |
-$5.35 |
|
60% |
834.7 |
$135.35 |
$87.98 |
$108.28 |
$128.58 |
-$47.37 |
-$27.07 |
-$6.77 |
|
70% |
1,056.3 |
$171.28 |
$121.39 |
$142.77 |
$164.15 |
-$49.88 |
-$28.51 |
-$7.13 |
|
80% |
1,378.1 |
$223.46 |
$212.83 |
$217.38 |
$221.94 |
-$10.63 |
-$6.07 |
-$1.52 |
|
90% |
2,004.3 |
$325.00 |
$390.75 |
$362.57 |
$334.39 |
$65.76 |
$37.57 |
$9.39 |
|
95% |
2,726.9 |
$442.17 |
$596.07 |
$530.11 |
$464.15 |
$153.90 |
$87.94 |
$21.99 |
|
99% |
4,260.3 |
$690.81 |
$1,031.76 |
$885.64 |
$739.51 |
$340.95 |
$194.83 |
$48.71 |
|
100% |
38,490.5 |
$6,241.23 |
$10,757.71 |
$8,822.08 |
$6,886.44 |
$4,516.47 |
$2,580.84 |
$645.21 |
When compared to the Domestic Tariff, all rates are markedly higher with the 1,000-kWh block than the blocks in the previous scenarios. For example, in the 99th percentile, customers pay 7.1%, 28.2%, and 49.4% for FB95, FB80, and FB5, respectively.
5 Discussion
5.1 Arguments for the block rate
The inverted block rate offers several advantages over the flat rate, including:
• Price signaling. The inverted block rate allows the energy supplier to introduce price signals: low consumption customers have less of an incentive to increase consumption as this leads to a higher price per unit of energy, while high consumption customers have an incentive to decrease consumption as this leads to a lower price per unit of energy.
• Same metering technology. The inverted block rate (and the flat rate) can use the same metering technology. This means that the energy supplier is not required to purchase new metering equipment and that existing meter-reading technology can still be used. The only change required by the energy supplier is in the billing software, as the data obtained from the meter (i.e., the record of the customer's energy consumption during the billing period) remains unchanged.
• Cross-subsidies. In the discussion on the flat-rate model, it was shown that cross-subsidization could occur as customers with demands that are not coincident with the system peak are overcharged for the price of a unit of energy, while those with demands that are coincident can be undercharged.
By introducing the inverted block rate structure, customers with small energy consumption requirements would be paying less, while those with large energy consumption requirements would be paying more. The shaded areas in Table 12 show those customers for whom these changes come closer to being cost reflective (i.e., the costs reflect the relationship between demand and energy consumption). Some energy suppliers report a strong correlation between large consumption customers and higher system demand, meaning that these price shifts are cost reflective (IPRT, 2003).
Table 12: Impact of inverted block rate during system peak
|
|
Demand during system peak is… |
|
|
|
Disproportionally lower than peak |
Disproportionally higher than peak |
|
Small customer |
Lower charges |
Lower charges |
|
Large customer |
Higher charges |
Higher charges |
The impact on customers in the non-shaded areas in Table 12 shows a movement in the wrong direction: small customers with disproportionately large demands during the peak should not have lower charges and large customers with disproportionately lower demands during the peak should not have higher charges.
In these cases, it is necessary to determine how many customers fall into these categories: if most customers are found in the shaded areas of Table 12, then the issue can probably be ignored. However, if significant numbers of large consumption customers have demand outside the peak, then it might be worth considering shifting these customers to a different rate class, for example, Nova Scotia Power's Time-of-Day tariff which uses the existing flat-rate ($0.16215/kWh) during the winter months (November to March), declining to $0.10651/kWh during the summer.
Similarly, low- or moderate-income customers with high energy consumption may be subject to higher charges in an inverted block rate environment. There are several ways in which these customers can be assisted, including changing their rate class, offering financial assistance to those who are low-income, or addressing their energy consumption patterns.
The result of replacing a flat rate model with an inverted block rate model is that rates become more cost reflective for:
• Small customers with a large portion of their demand that is not coincident with the system peak.
• Large customers with a large portion of their demand that is coincident with the system peak.
Although the inverted block rate allows price signaling and reduces the impact of cross-subsidies, it does not have a time component, meaning that (like the flat rate), there is no incentive for customers to shift their demand from the system peak. To be successful, an inverted block rate program requires the energy supplier to educate customers of the benefits of lifestyle changes that can result in decreases in the price per unit of energy.
5.2 Arguments against the block rate
One argument against changing from the flat-rate model to the inverted block rate model is that customers with consumptions less than the first-block size would use more as there would be no incentive to consume less energy (Newfeld & Watts, 1981).
This argument depends on the first-block size, its rate, and the customer's economic situation. Whether a low- or moderate-income consumer whose consumption is less than the first block limit will consume more energy simply because the price per unit of energy is less than that of the next block appears to depend on the customer's socio-economic situation (McLoughlin, Duffy, & Conlon, 2012).
A second argument against the block rate structure is that high-consumption consumers will cross-subsidize low-consumption consumers. One solution to this problem is to offer the customers a different rate structure such as time-of-use rate. However, such a change would need to be considered carefully, as Nova Scotia Power's non-electric-heating winter (November through March) on-peak rate (7:00am to 11:00am and 5:00pm to 9:00pm) of $0.32429 exceeds the maximum scenario tail-block rate of $0.27949.
An alternative approach would be to offer high-consumption, low- and moderate-income customers who are affected financially by the block-rate some form of subsidy.
For the proposed inverted rate structure to succeed, it is necessary to ensure that customers are fully aware of the benefits of the program (notably, a reduction in the unit cost per unit energy and a reduction in cross-subsidies). The new structure would have to be introduced with an ongoing education campaign. Part of the campaign would include a breakdown of the energy prices in terms of each block and the resulting price per kilowatt-hour as part of each customer's bill (for example, see (Hydro Ottawa, 2022)). This type of information could help customers understand the financial benefits of reducing their consumption.
5.3 The Block Rate Scenarios
The three block-rate scenarios were presented to show the effects of varying the first-block rate and block size. The three first-block rates were fractions of Nova Scotia Power's existing Domestic Tariff of $0.16215; with these, the tail-block rates were calculated. The first- and tail-block rates and the first-block sizes were then applied to Nova Scotia Power's residential customer consumption data to produce nine different tariff scenarios. All scenarios were revenue neutral.
The results showed that:
• As the first-block size increases, the tail-block rate increases.
• As the first-block rate increases (nearing the value of the Domestic Tariff), the tail-block rate decreases.
This requires the regulatory agency to find the right combination of first-block size and first-block rate to maximize the number of low-consumption customers benefiting from the tariff, while minimizing the cross-subsidies needed from high-consumption customers.
One way to compare different block rates is to compare the ratio of the first-block rate to the tail-block rate: as the ratio approaches 1, the two rates are converging, and as the ratio decreases, the two rates are diverging, requiring high-consumption consumers to pay more to subsidize low-consumption consumers. Figure 6 shows the first-block-to-tail-block ratios of the nine scenarios and the four energy providers with inverted block rates discussed in the Introduction.
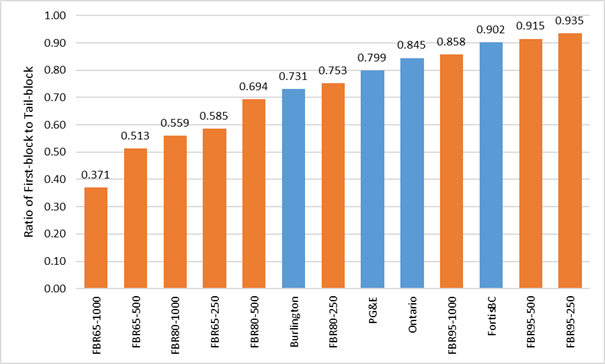
Figure 6: First-block-to-tail-block
ratios for scenarios (Orange) and other energy providers (Blue)
(Scenario labels refer to first-block ratio and block size)
The following observations can be made with respect to the nine scenarios:
• The 250 kWh first-block scenario has the lowest percentage increase over the Domestic Tariff for all customers, regardless of the rate; however, it has the lowest cost savings because of the block size.
• In the 500-kWh scenario, almost 74% of customers pay less than the Domestic Tariff and make greater savings than in the 250-kWh scenario. However, his means high-consumption customers pay considerably more per kilowatt-hour.
• About 82% of customers pay less per kilowatt-hour in the 1000-kWh scenario than do the high-consumption customers who pay as much as 72% more than had they been using the Domestic Tariff.
Deciding on an acceptable combination of first-block rate and size and tail-block rate would be the responsibility of the regulatory agency in consultation with stakeholders and Nova Scotia Power.
6 Summary
As the prices of an energy provider's energy mix change, the charge to the customer must change as well to let the costs be recovered. Energy providers have a variety of billing methods to collect these costs from their customers, including the flat rate, time-of-use rate, and the block (or tiered) rate.
This paper has examined the possible application of an inverted block rate to Nova Scotia Power's existing residential customers, replacing the existing flat rate or Domestic Service Tariff. A method was derived which when applied to an existing flat rate data set produced a two-block inverted block rate model. A total of nine models were produced, using three first-block prices (65%, 80%, and 95% of the Domestic Service Tariff) and three first-block sizes (250, 500, and 1000 kWh).
The scenarios highlighted one of the principal differences between the block rate and a flat rate: the block rate acts like a flat rate up to the block-size limit, beyond that the block rate becomes a function of the volume of electricity up to the limit (charged the first-block rate) and the volume of electricity in the next block (charged the tail-block rate in a two-block system). Consequently, no customer could be charged the full tail-block rate.
Since the rate is a of the volume consumed, customers pay less per kilowatt-hour as they reduce their consumption, whereas in the flat-rate model, the rate remains constant when consumption is reduced.
The results showed that for customers, modest cost reductions could be made in the 250-kWh block scenario, maximizing at between $2.03 and $14.19. The savings increased as the block sizes increased, reaching a maximum of between $4.05 and $28.28 in the 500-kWh block and $8.11 and $86.75 in the 1000-kWh block scenarios.
Such savings would undoubtedly be appreciated by the customers; however, since the model is revenue neutral, higher consumption customers are charged the Domestic Service Tariff. As the block size increases, the number of customers paying less than the Domestic Service Tariff also increases, meaning there are fewer high-volume customers remaining to subsidize the lower-volume customers.
It is necessary to have policies to support high-consumption customers: low-income customers can be offered financial support to cover the excess costs, while high-income customers can either stay with the flat rate or opt for another rate model, such as a time-of-use rate. Either way, the options must be made clear and the customers educated about the changes they can expect to see with the introduction of a new rate system.
No rate structure is perfect. For the structure to be accepted, a regulator needs to select a first-block size and price that benefits low-consumption consumers while limiting the impact on high-consumption customers.
Acknowledgements
The author would like to thank Jim Simmons, Mike Shea, Sandy Cook, and Sheheryar Mubarak for their valuable contributions to this paper.